There’s a lot of information at your fingertips once you load your dashboard; here’s a quick guide to understanding the metrics and data presented.
Here’s a sample layout of the coordinator dashboard. We’re going to run through each panel and what it’s used for.

Open/Active Panels

The open/active panels are used to identify how many tickets you have open and also identify which of those tickets are considered “active”.
You should think of active tickets as “Tickets that can be actioned right now”. While you may have 74 total tickets open, perhaps many of them are waiting for parts or waiting on customers. In these instances, the ticket would not be considered “Active”.
Navigate to https://[your domain].techrodactyl.io/settings and set which statuses you consider inactive under the “Inactive statuses” heading.
This gives you a real indication of how busy your helpdesk is.
Kill Rate Statistics
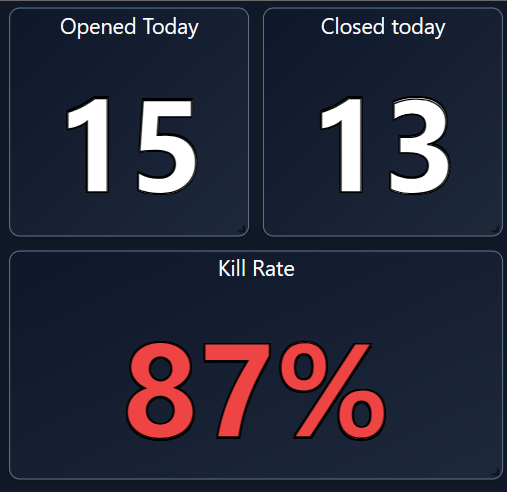
The kill rate is useful to identify how successful your helpdesk has been today. If the kill rate is less than 100%, that means that more tickets have been created than have been resolved.
One of the core metrics for any helpdesk is to ensure that a 100% kill rate is achieved as often as possible.
Response Time

There are no two ways about it, quick response time = happy customers. Across all of our customers, we see an average response time of 1 hour. Keeping initial response times short, helps your customers to know that you have their ticket and are working toward a resolution.
Hours Logged

Two panels display the hours logged statistics. One panel displays the total logged across all technicians, and the other shows how much time has been logged per technician.
Depending on how many hours you expect to see here each day, you can adjust the thresholds for this metric on the settings page of your portal.
All Tickets – (Technician Load)

The technician load panel is one of the most important panels for coordinators, managers and business owners. It allows you to identify which technicians are overloaded easily. You can toggle which statuses are displayed in the panel by clicking on the bottom legend.

For example, you may wish to select only active statuses, so you can see the technical load on each of your technicians. Alternatively, you may wish to only select admin statuses to see how much admin backlog each technician has.
The centre quad

The goal of the technical team, or your coordinator, is to make sure that these 4 panels show 0 results as often as possible.
Panel 1 – New Tickets
Represent tickets with the status of “new”.
New tickets should be responded to and assigned to a technician as soon as possible to assist with your average response time.
Ideally, when a ticket has an initial response, it should be given a new status such as “Ready for Action”. And once a ticket has been reviewed by a technician, an ideal status would be “reviewed by tech”.
Panel 2 – Stale Tickets
Stale tickets are open tickets which have not had a public note added in X days (you can define this limit in the settings page). Customers should be kept up to date with the status of their tickets regularly to keep customer satisfaction high.
Panel 3 – Tickets with replies
Tickets with replies show tickets with the status “customer reply”. This means that the job has new information which needs to be reviewed. Once the ticket has been changed to a new status, the ticket will clear from panel 3.
Panel 4 – Unassigned Tickets
If it’s everyone’s responsibility, its no one’s responsibility. This panel identifies tickets that are not yet assigned to a technician for action.